Meridian Chart Desk
AI generated. A complete chart drawing desk with CSV candle imports, exact coordinate editing, undo and redo, portable workspaces and source labeled SVG export.
Screenshots
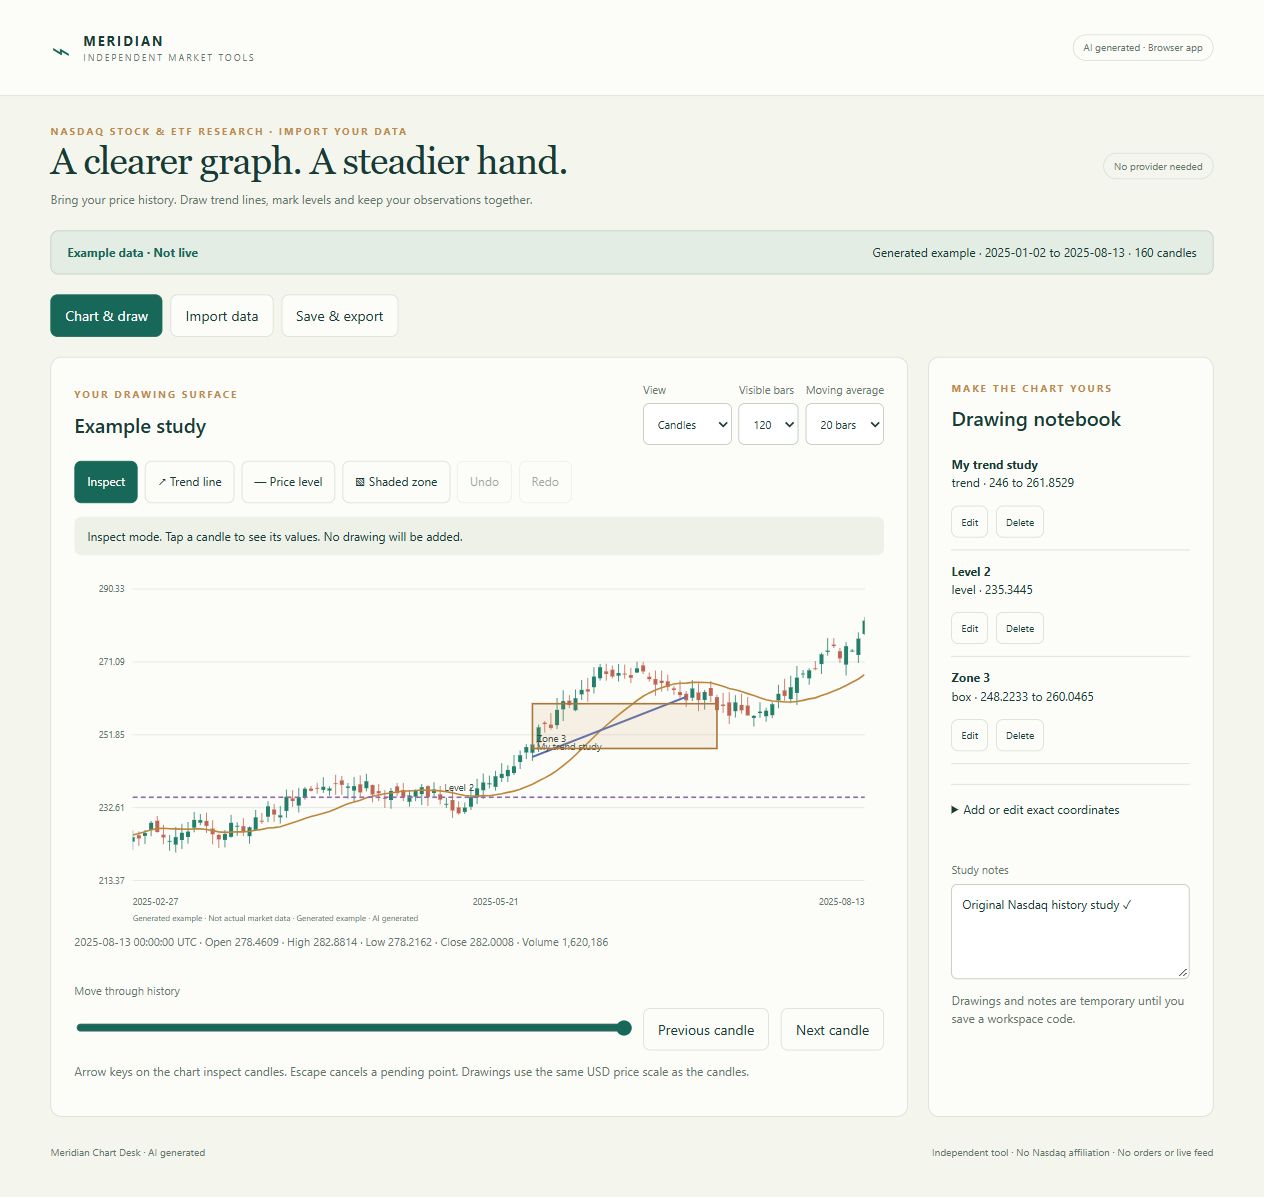

Screenshots supplied by the seller.
Description
AI generated. Meridian Chart Desk makes historical chart annotation direct and understandable. Choose a trend line, horizontal price level or shaded zone, then place its points on the graph. A separate coordinate form supports precise keyboard entry and later editing. Drawings remain attached to dates and prices while the visible window or chart type changes.
Move through history, inspect candle values and add a 20 or 50 bar simple moving average calculated from the full active series. Keep notes alongside your drawings. Save data, source labels, chart settings and annotations together in a checked workspace code. Prepare an editable SVG graph with source and AI disclosures.
This independent browser tool is intended for Nasdaq stock and ETF research using data you import. The included example values are original generated data, not actual or live Nasdaq prices. There is no provider connection, brokerage link, exchange affiliation or order execution. The hosted demo uses the same application code and works without external network requests.
Condition
Development stage: Mostly built (seller-declared)
Seller-declared: provided by the seller, not independently verified by SellMyVibe.
- Solo creator
- Mainly AI-generated
- Under one month in development
- Tests included
- Setup guide included
- Demo available
What works
- Validated OHLC CSV import with atomic failure handling
- Trend lines, price levels and shaded zones placed by chart taps or exact coordinates
- Drawing labels, editing, deletion and up to 100 drawing undo steps
- Candle and line views, history window controls and full series simple moving averages
- Text candle inspection and recent values table
- Study notes, UTF8 workspace codes and editable SVG graph export
What’s unfinished
No live feed, broker connection, cloud accounts, automatic price adjustment, exchange membership validation or native application.
Included assets
Editable application source
Original generated example data
CSV format guide
Setup and usage documentation
Repeatable calculation checks
Real running interface screenshots
Verification notes and asset license
Technologies
HTML, CSS, JavaScript, original SVG charts
Setup requirements
Open index.html in a current browser or use any static server. The hosted demo runs the same offline application. Choose Import data for the documented CSV format. Included examples are clearly labeled and may be explored without an import.
Dependencies and ongoing costs
A current browser. No paid service, provider account, external library or build step for the application. Node is needed only for optional supplied core checks. Imported data must be obtained under terms that permit your intended use.
Known limitations
Up to 5000 candles and 200 drawings per study. Line and zone endpoints must correspond to dates in the active data. Drawing undo covers annotations, not imports or notes. The simple moving average does not adjust prices for corporate actions. A chart annotation is not a trading signal or recommendation. No live data is supplied. Imported values and source labels are provided by the user and are not independently verified. Corporate actions, exchange calendars and investment suitability are not checked. No automatic storage. Save your work explicitly. Browser download and clipboard permissions can vary; text export alternatives are supplied where relevant.
Listings are reviewed for completeness and clarity before publication. Approval is not a guarantee of quality, ownership, security or commercial success. Read the details and ask questions before buying.